RELEASE 8: HEALTH, DISABILITY AND UNPAID CARE
On the 19th January 2022, the Office for National Statistics released detailed univariate data from the 2021 Census covering the theme of ‘Health, Disability and Unpaid Care’.
This release includes the following data data:
| General Health | General Health Age Standardised Proportions |
Output Area (OA) Local Authority (LA) |
|---|---|---|
| Disability | Disability Age Standardised Proportions |
Output Area (OA) Local Authority (LA) |
| Unpaid Care | Provision of Unpaid Care Age Standardised Proportions |
Output Area (OA) Local Authority (LA) |
The data can be accessed on the Data Observatory via the updated Health and Social Care Profile or via the Data Explorer.
To find out more about how to view this data in the Data Observatory please see our dedicated Census Phase 1 Update
You can also can access the data directly from the ONS website HERE
You can find an infographic highlighting the headline results for Hull here:
Summary Infographic: Health, Disability and Unpaid Care
Below you will find summary information for Hull which includes, for each of the three key areas listed above:
- Headline results
- Maps of useful datasets at Lower Super Output Area (LSOA) Level
A NOTE ON AGE STANDARDISED PROPORTIONS (ASPs)
As part of this release, ONS have produced regular counts / proportions of population health, disability and provision of unpaid care.
However, health, disability and unpaid care, are all closely related to the age of a population. In a more elderly population, you would expect poorer health, more disability and more unpaid care.
Therefore, to enable individuals to make meaningful comparisons of health, disability and unpaid care outcomes when we compare across age groups, over time or between geographies, ONS have also published age standardised proportions. Age-standardised proportions (ASPs) take into consideration both population size and age-structure, essentially evening them out so that you can compare like with like.
Standardised data is valuable to users who would want to understand differences in one area in comparison with others. Which areas are doing better or worse? Has health improved or got worse over time? This has implications for policy making, holding organisations that spend public money to account, and informing wider public debate. However, age-standardised data is only available as proportions.
Of course, there are instances where it is more useful to use non-standardised data. Service providers like local authorities, GPs, social services and local charities are more likely to need to know about the population in their area and what proportion have health concerns or a disability. This helps in understanding what needs exist in an area and planning service provision to support them. Non-age-standardised data is available as numbers and proportions.
Age-standardised proportions (ASPs) are used throughout this commentary; they allow for comparison between populations over time and across geographies, as they account for differences in the population size and age structure. The exceptions are in any tables showing actual population numbers and in any maps, both of which will be clearly marked as non-age-standardised data.
GENERAL HEALTH
Respondents were asked to assess their general health on a five-point scale: “Very good”, “Good”, “Fair”, “Bad”, or “Very bad”.
Census 2021 was conducted during the coronavirus (COVID-19) pandemic. This may have influenced how people perceive and rate their health and therefore may have affected how people chose to respond.
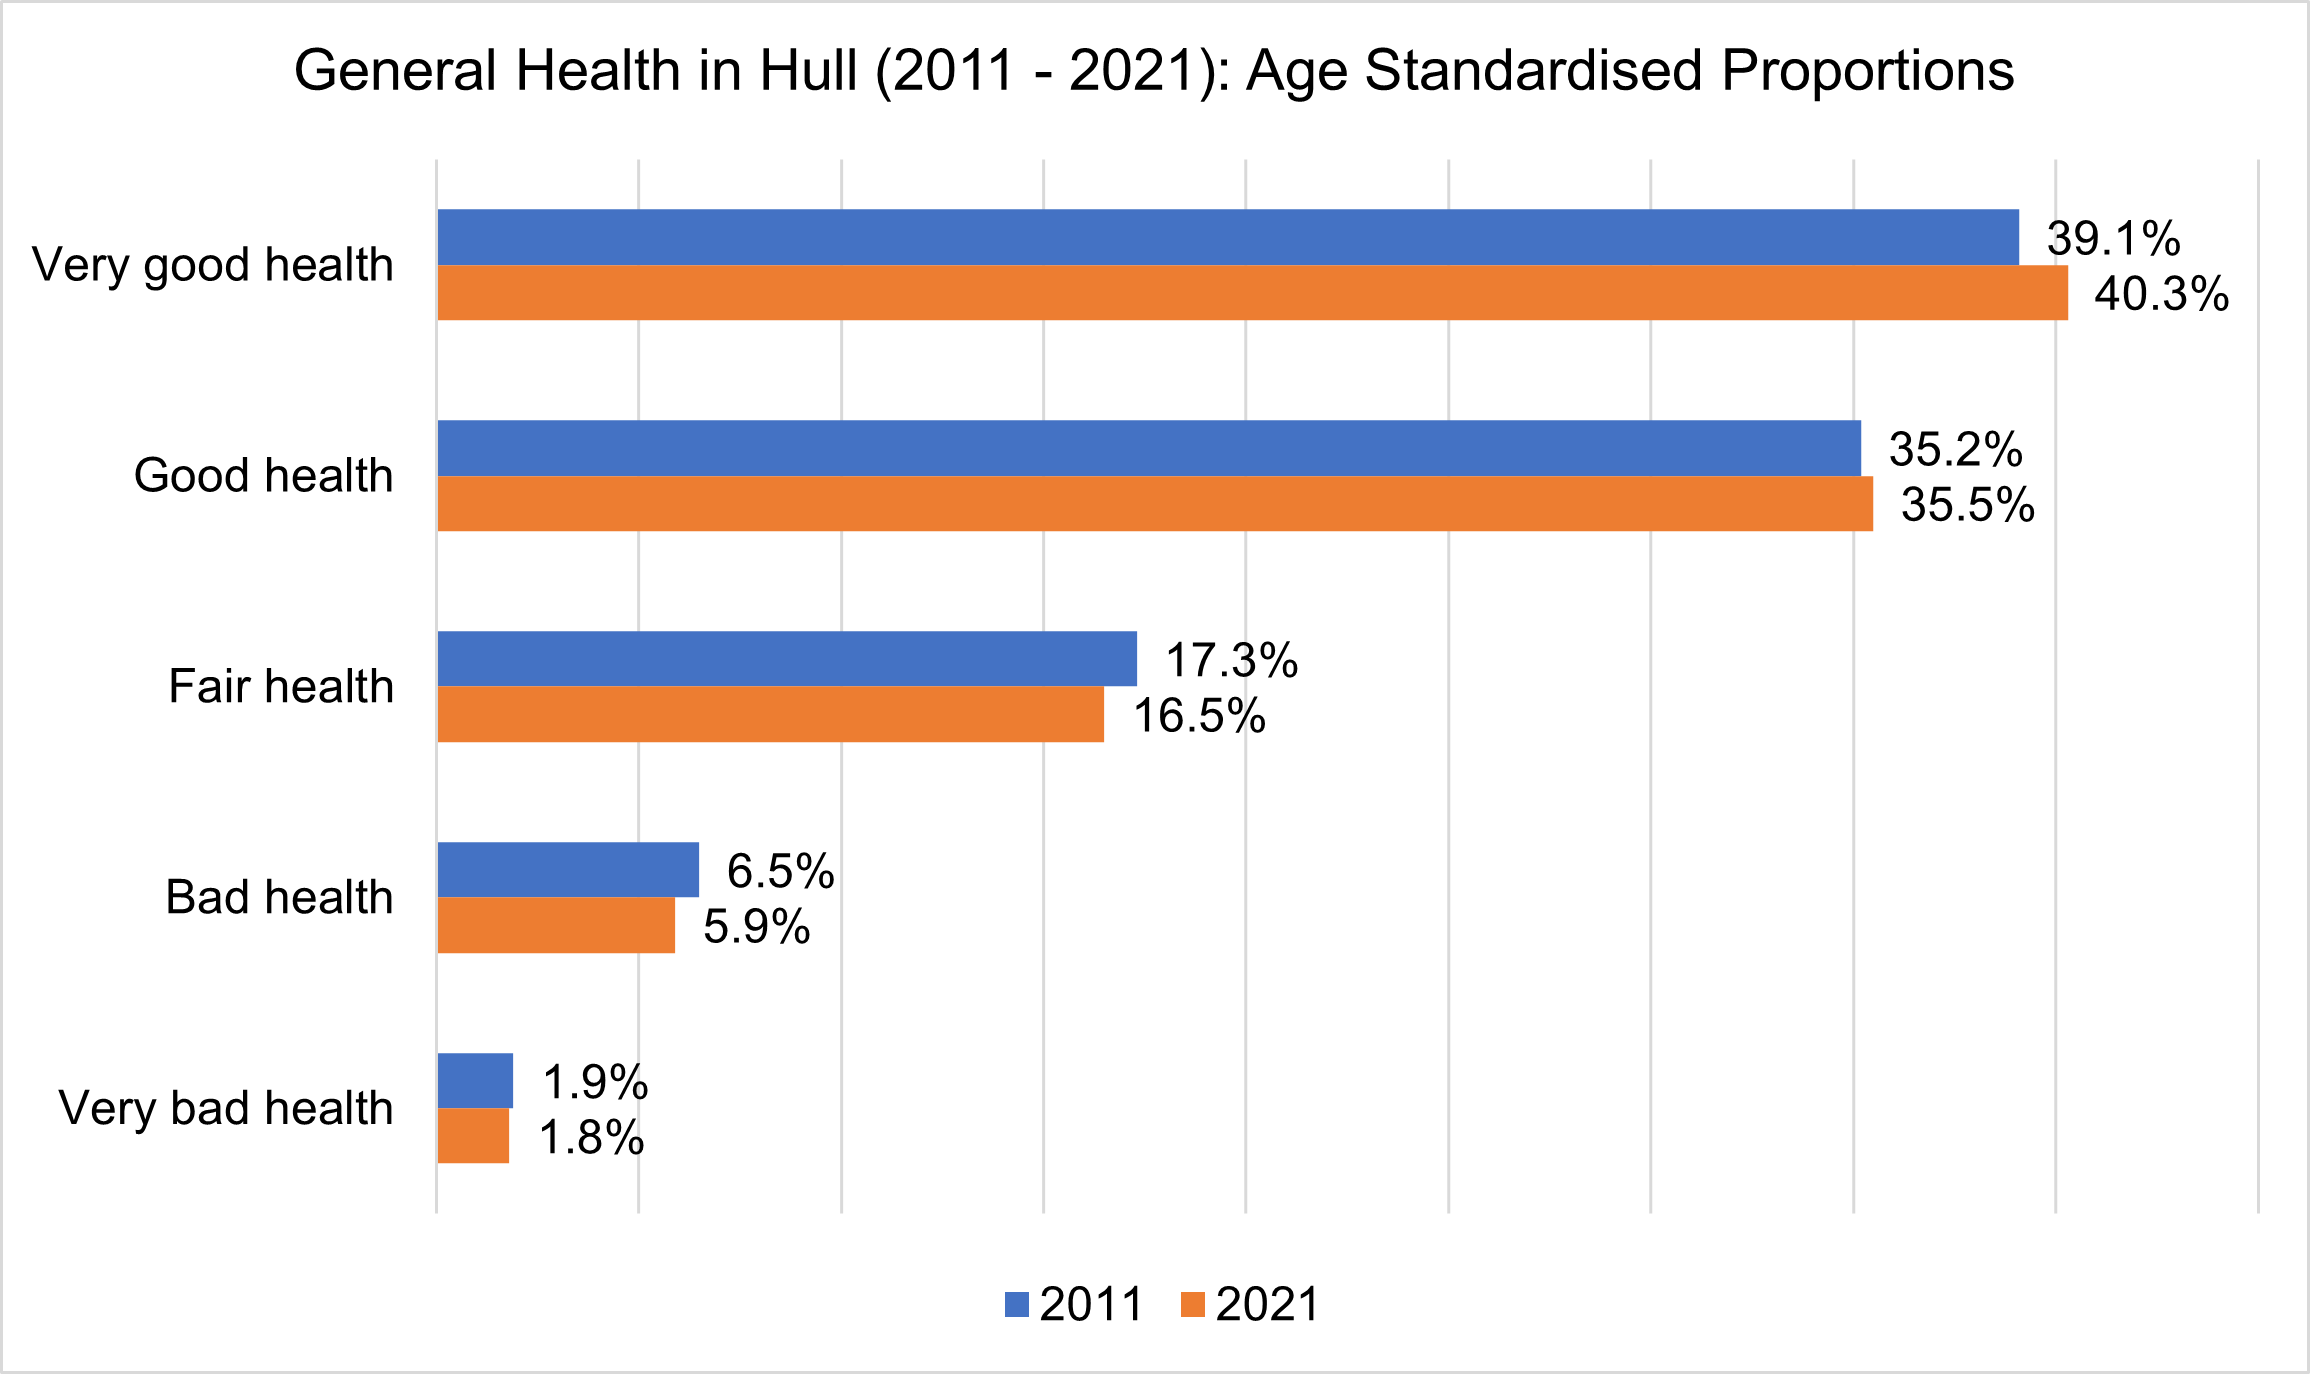
CHANGE 2011 – 2021 (AGE-STANDARDISED PROPORTIONS)
In Hull, the data on health shows a slight increase in the proportion of people reporting very good and good health, and small decreases in all other categories.
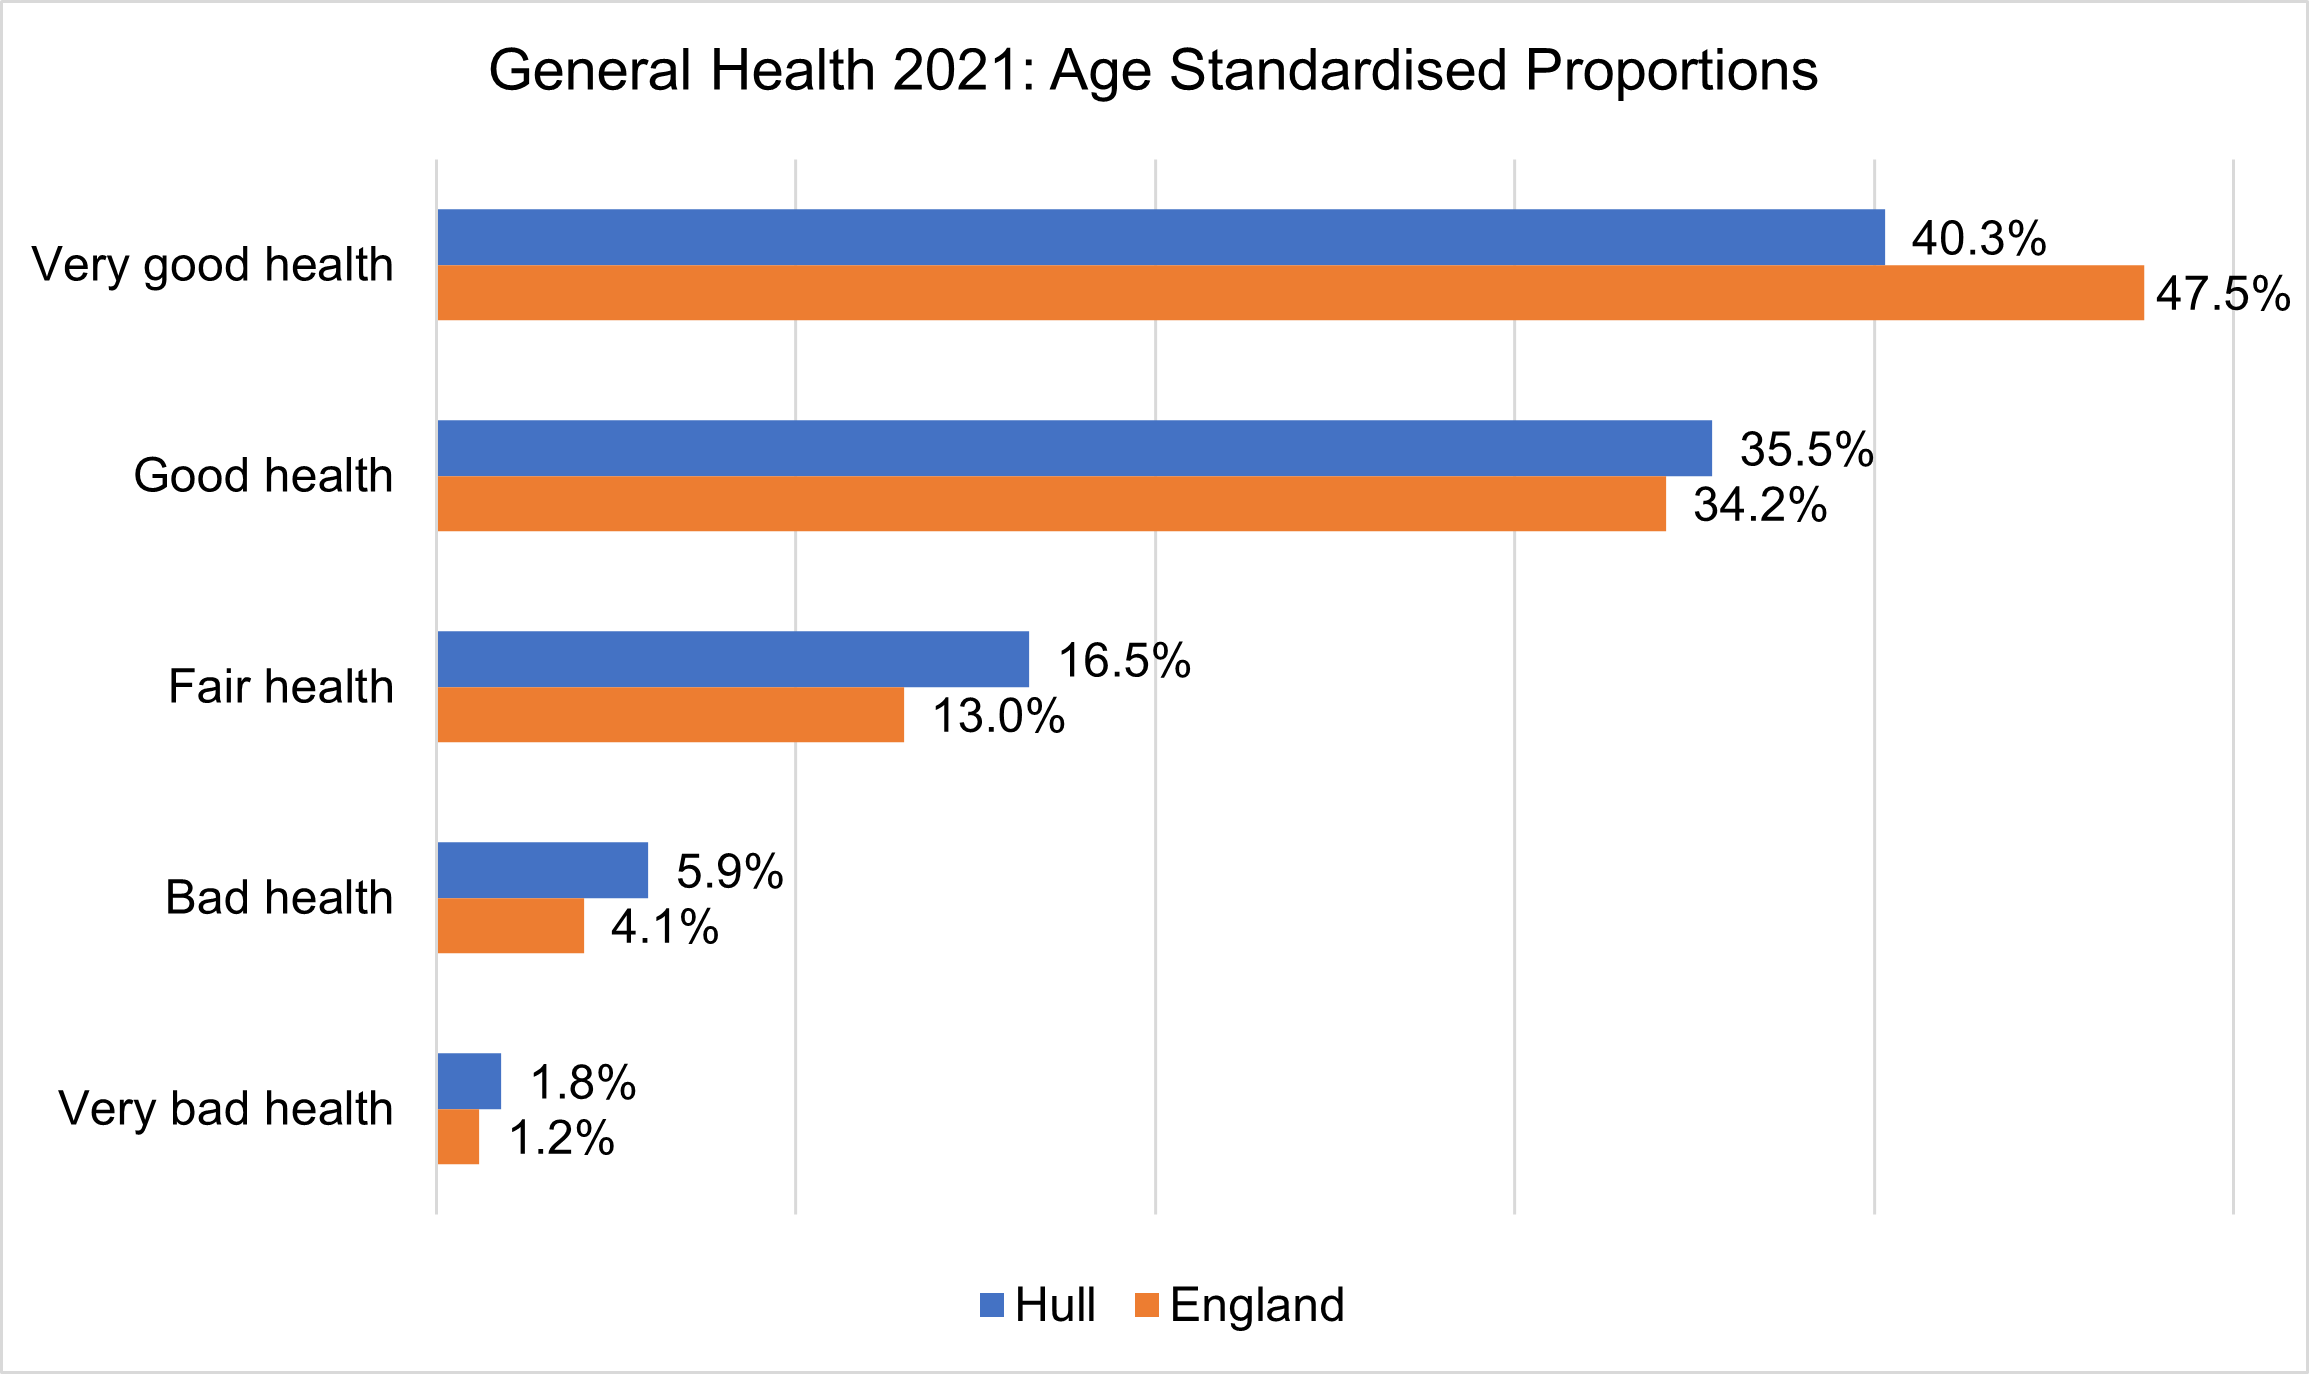
COMPARISON WITH ENGLAND (AGE-STANDARDISED PROPORTIONS)
In Hull, the data on health shows that there is a smaller proportion of people in very good health compared to England, but a larger proportion in all other categories.
NUMBERS AND MAPS (NON-AGE-STANDARDISED DATA)
- 208,926 residents of Hull reported their health as good or very good
- 39,851 residents of Hull reported their health as fair
- 18,237 residents of Hull reported their health as bad or very bad
| Hull (2021) | England (2021) | Hull (2011) | |
|---|---|---|---|
| Very Good Health | 115,776 (43.4%) | 48.5% | 110,555 (43.1%) |
| Good Health | 93,150 (34.9%) | 33.7% | 89,572 (34.9%) |
| Fair Health | 39,851 (14.9%) | 12.7% | 38,102 (14.9%) |
| Bad Health | 13,999 (5.2%) | 4.0% | 14,047 (5.5% |
| Very Bad Health | 4,238 (1.6%) | 1.2% | 4,130 (1.6%) |
2021 Census Map: Self Report Health – Good / Very Good (LSOA)
2021 Census Map: Self Report Health – Bad/ Very Bad (LSOA)
DISABILITY
To identify disability in England and Wales, the 2021 Census asked people “Do you have any physical or mental health conditions or illnesses lasting or expected to last 12 months or more?”. If they answered yes, a further question “Do any of your conditions or illnesses reduce your ability to carry out day-to-day activities?” was presented. The identification of disability differs from the 2011 Census question used, which asked “Are your day-to-day activities limited because of a health problem or disability which has lasted, or expected to last, at least 12 months?”.
The question changed in order to collect data that more closely aligned with the definition of disability in the Equality Act (2010). The Equality Act defines an individual as disabled if they have a physical or mental impairment that has a substantial and long-term negative effect on their ability to carry out normal day-to-day activities. The way Census identify disabled people has therefore changed between 2011 and 2021 and this may have had an impact on the number of people identified as disabled.
Census 2021 was undertaken during the coronavirus (COVID-19) pandemic, which may also have influenced how people perceive their health status and activity limitations and therefore may affect how people chose to respond.
Census 2021 also collected information on the number of household members that were disabled. It is not possible to age standardise at a household level, therefore, these proportions reported in this section are not standardised.
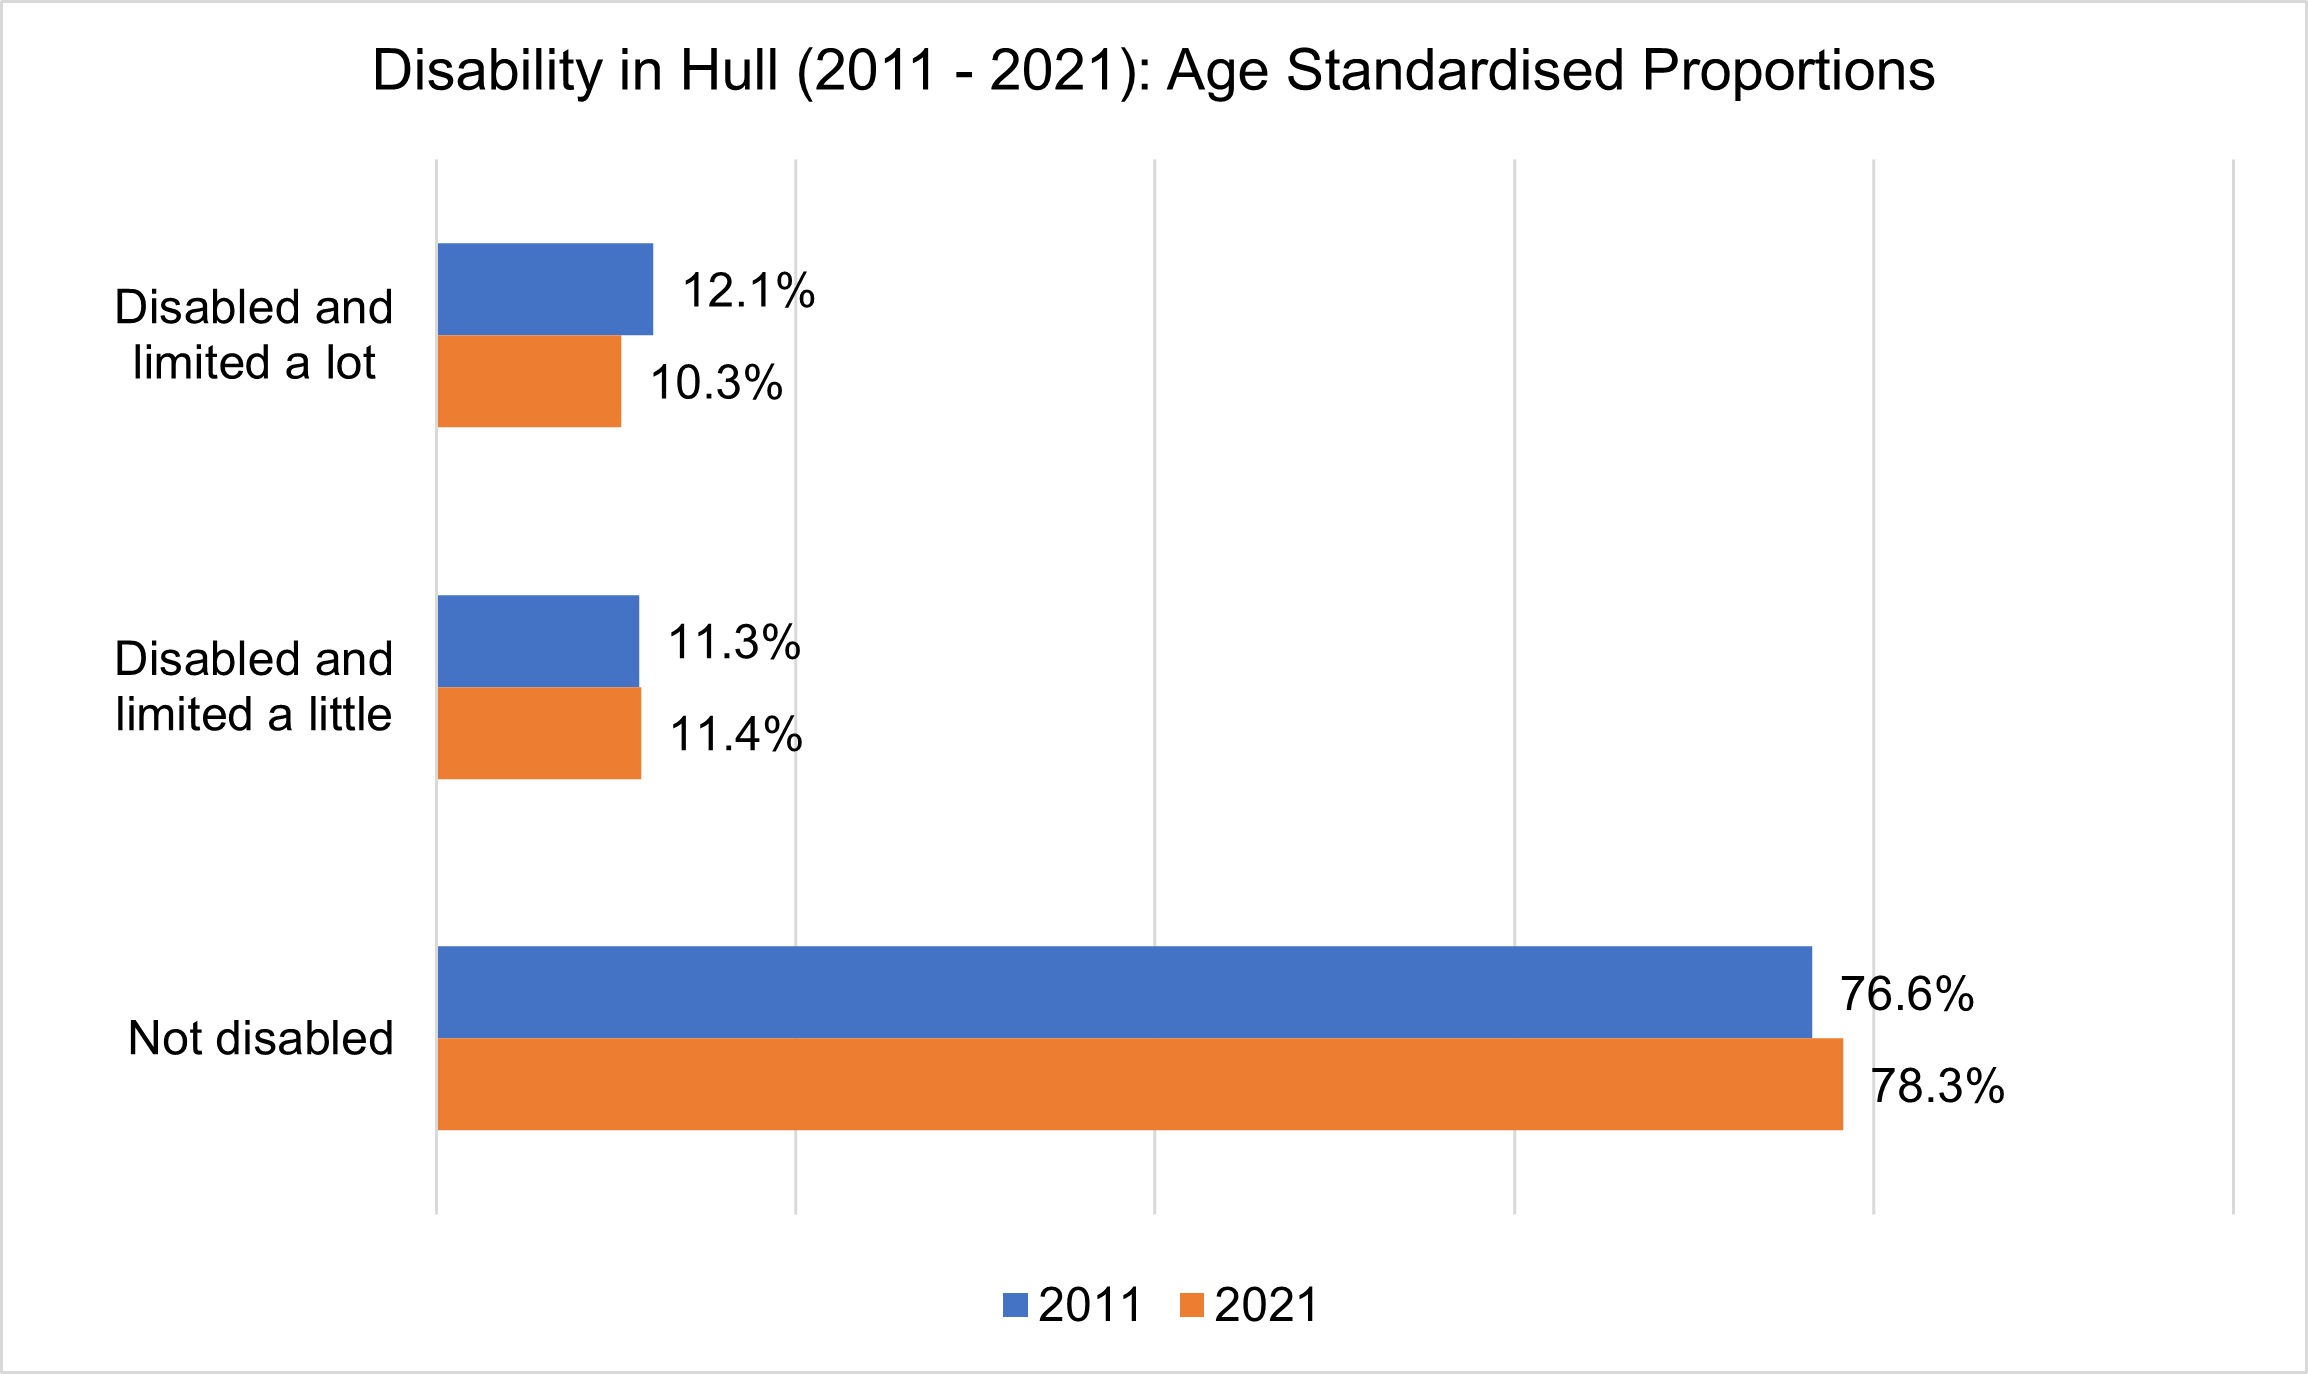
CHANGE 2011 – 2021 (AGE-STANDARDISED PROPORTIONS)
In Hull, the data on disability shows a slight increase in the proportion of people who are not disabled, the result of a decrease in the proportion of people who are disabled and limited a lot.
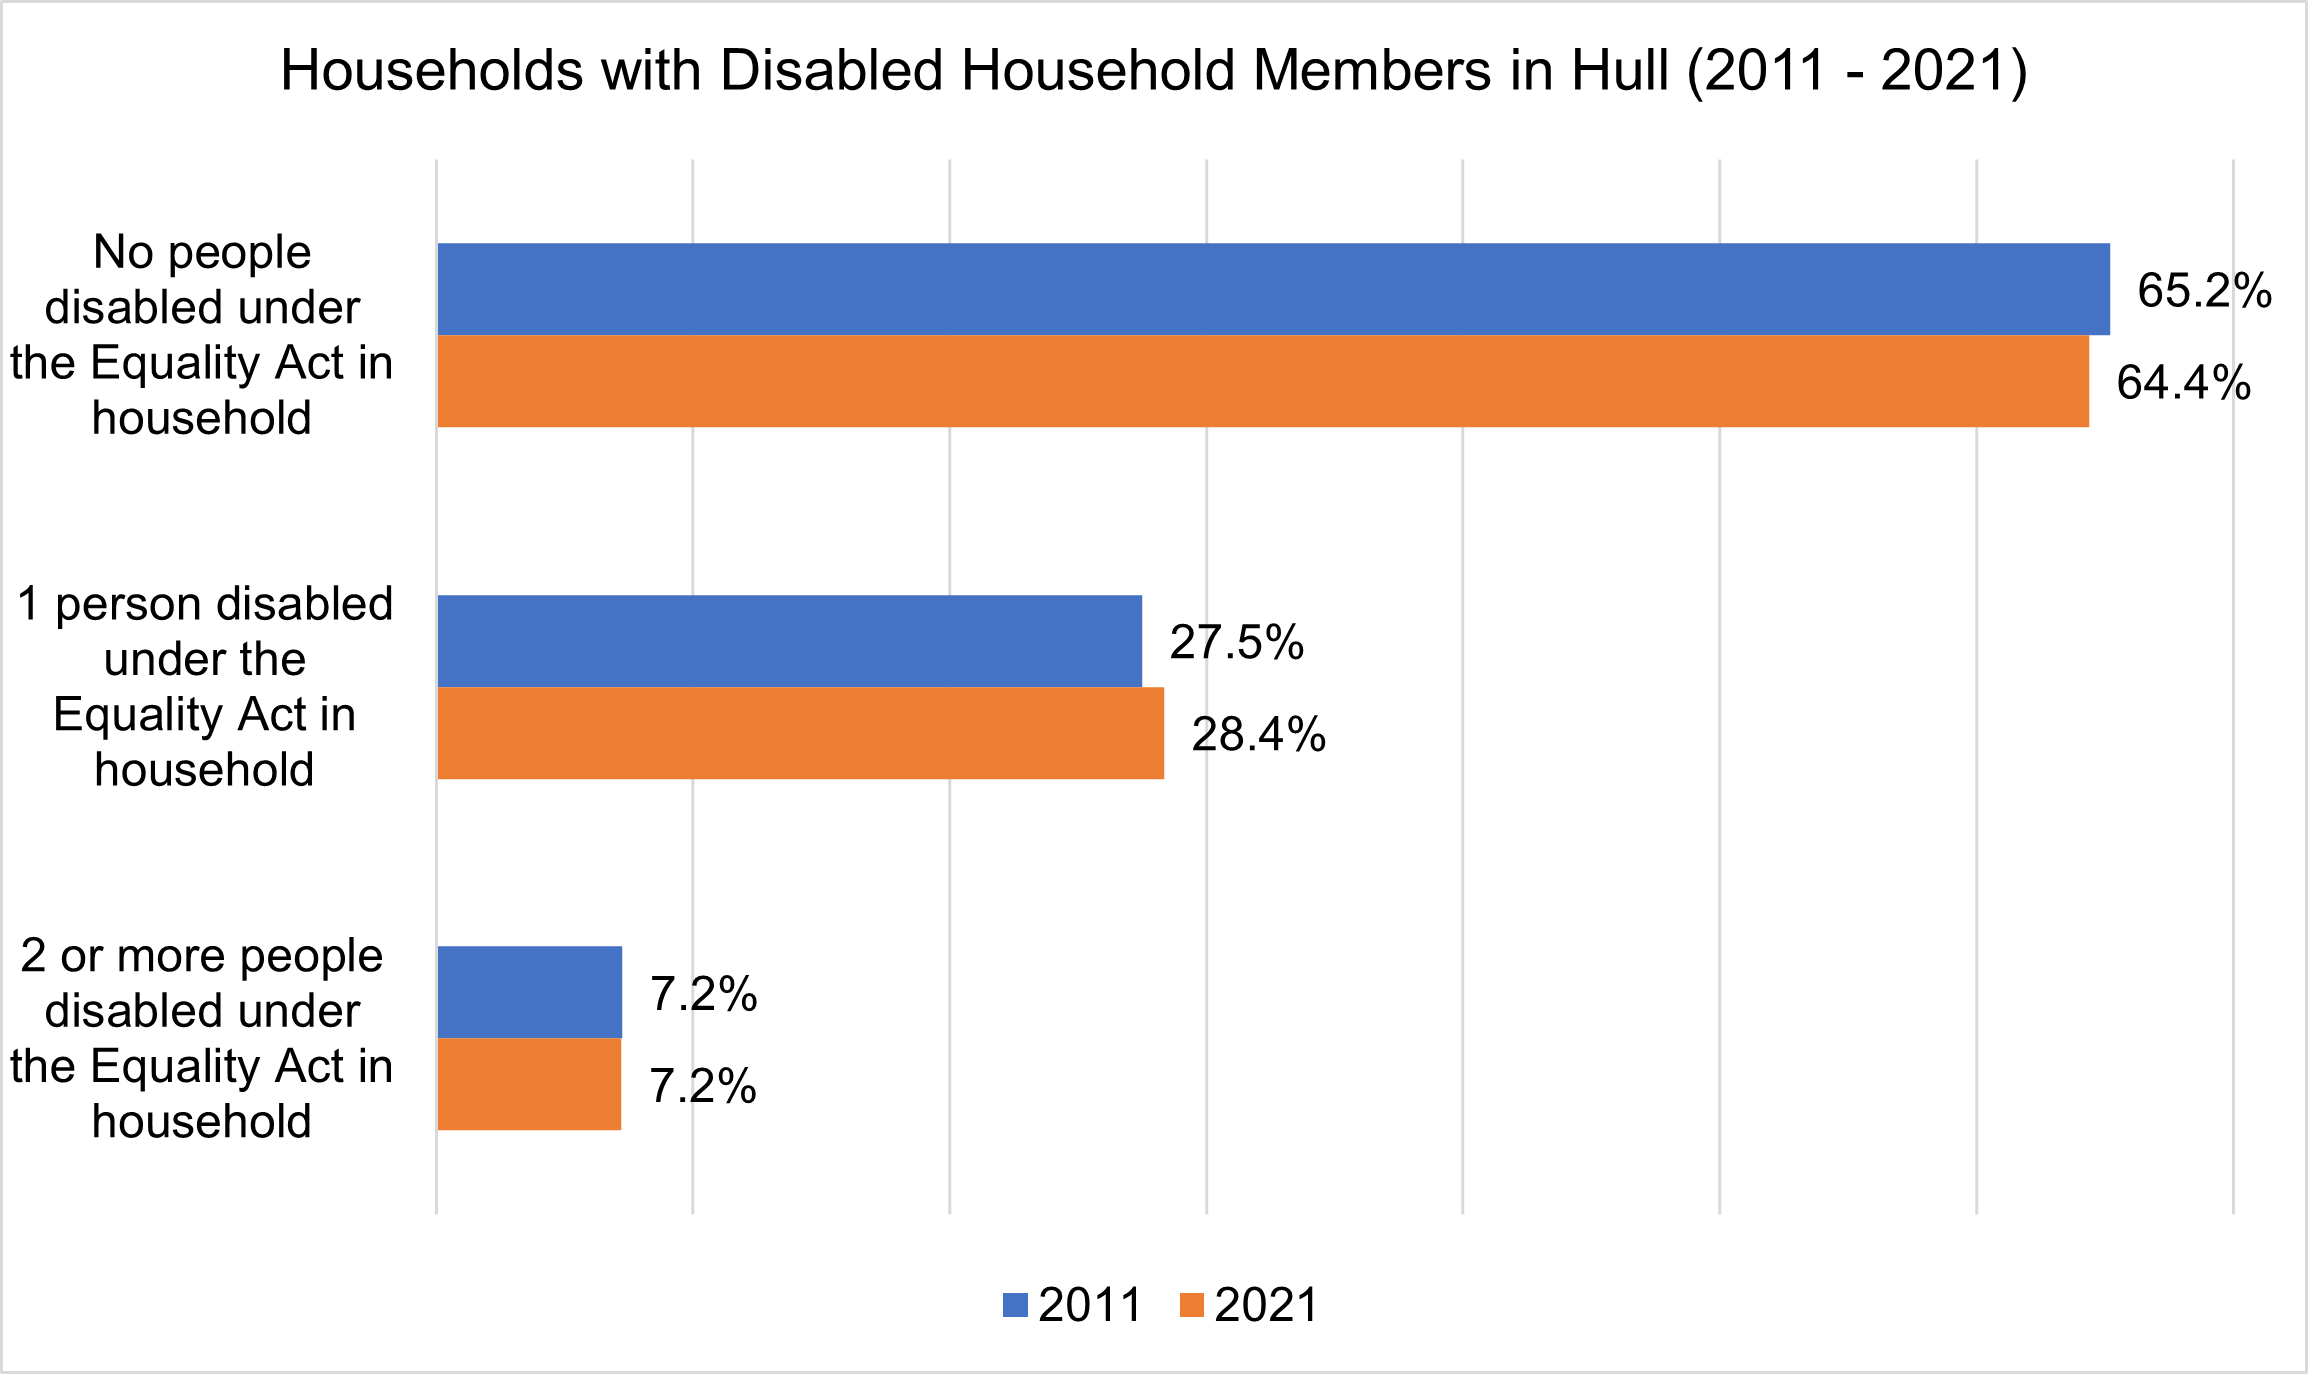
That said, there has been a small increase in the proportion of households with disabled household members; specifically one disabled household member.
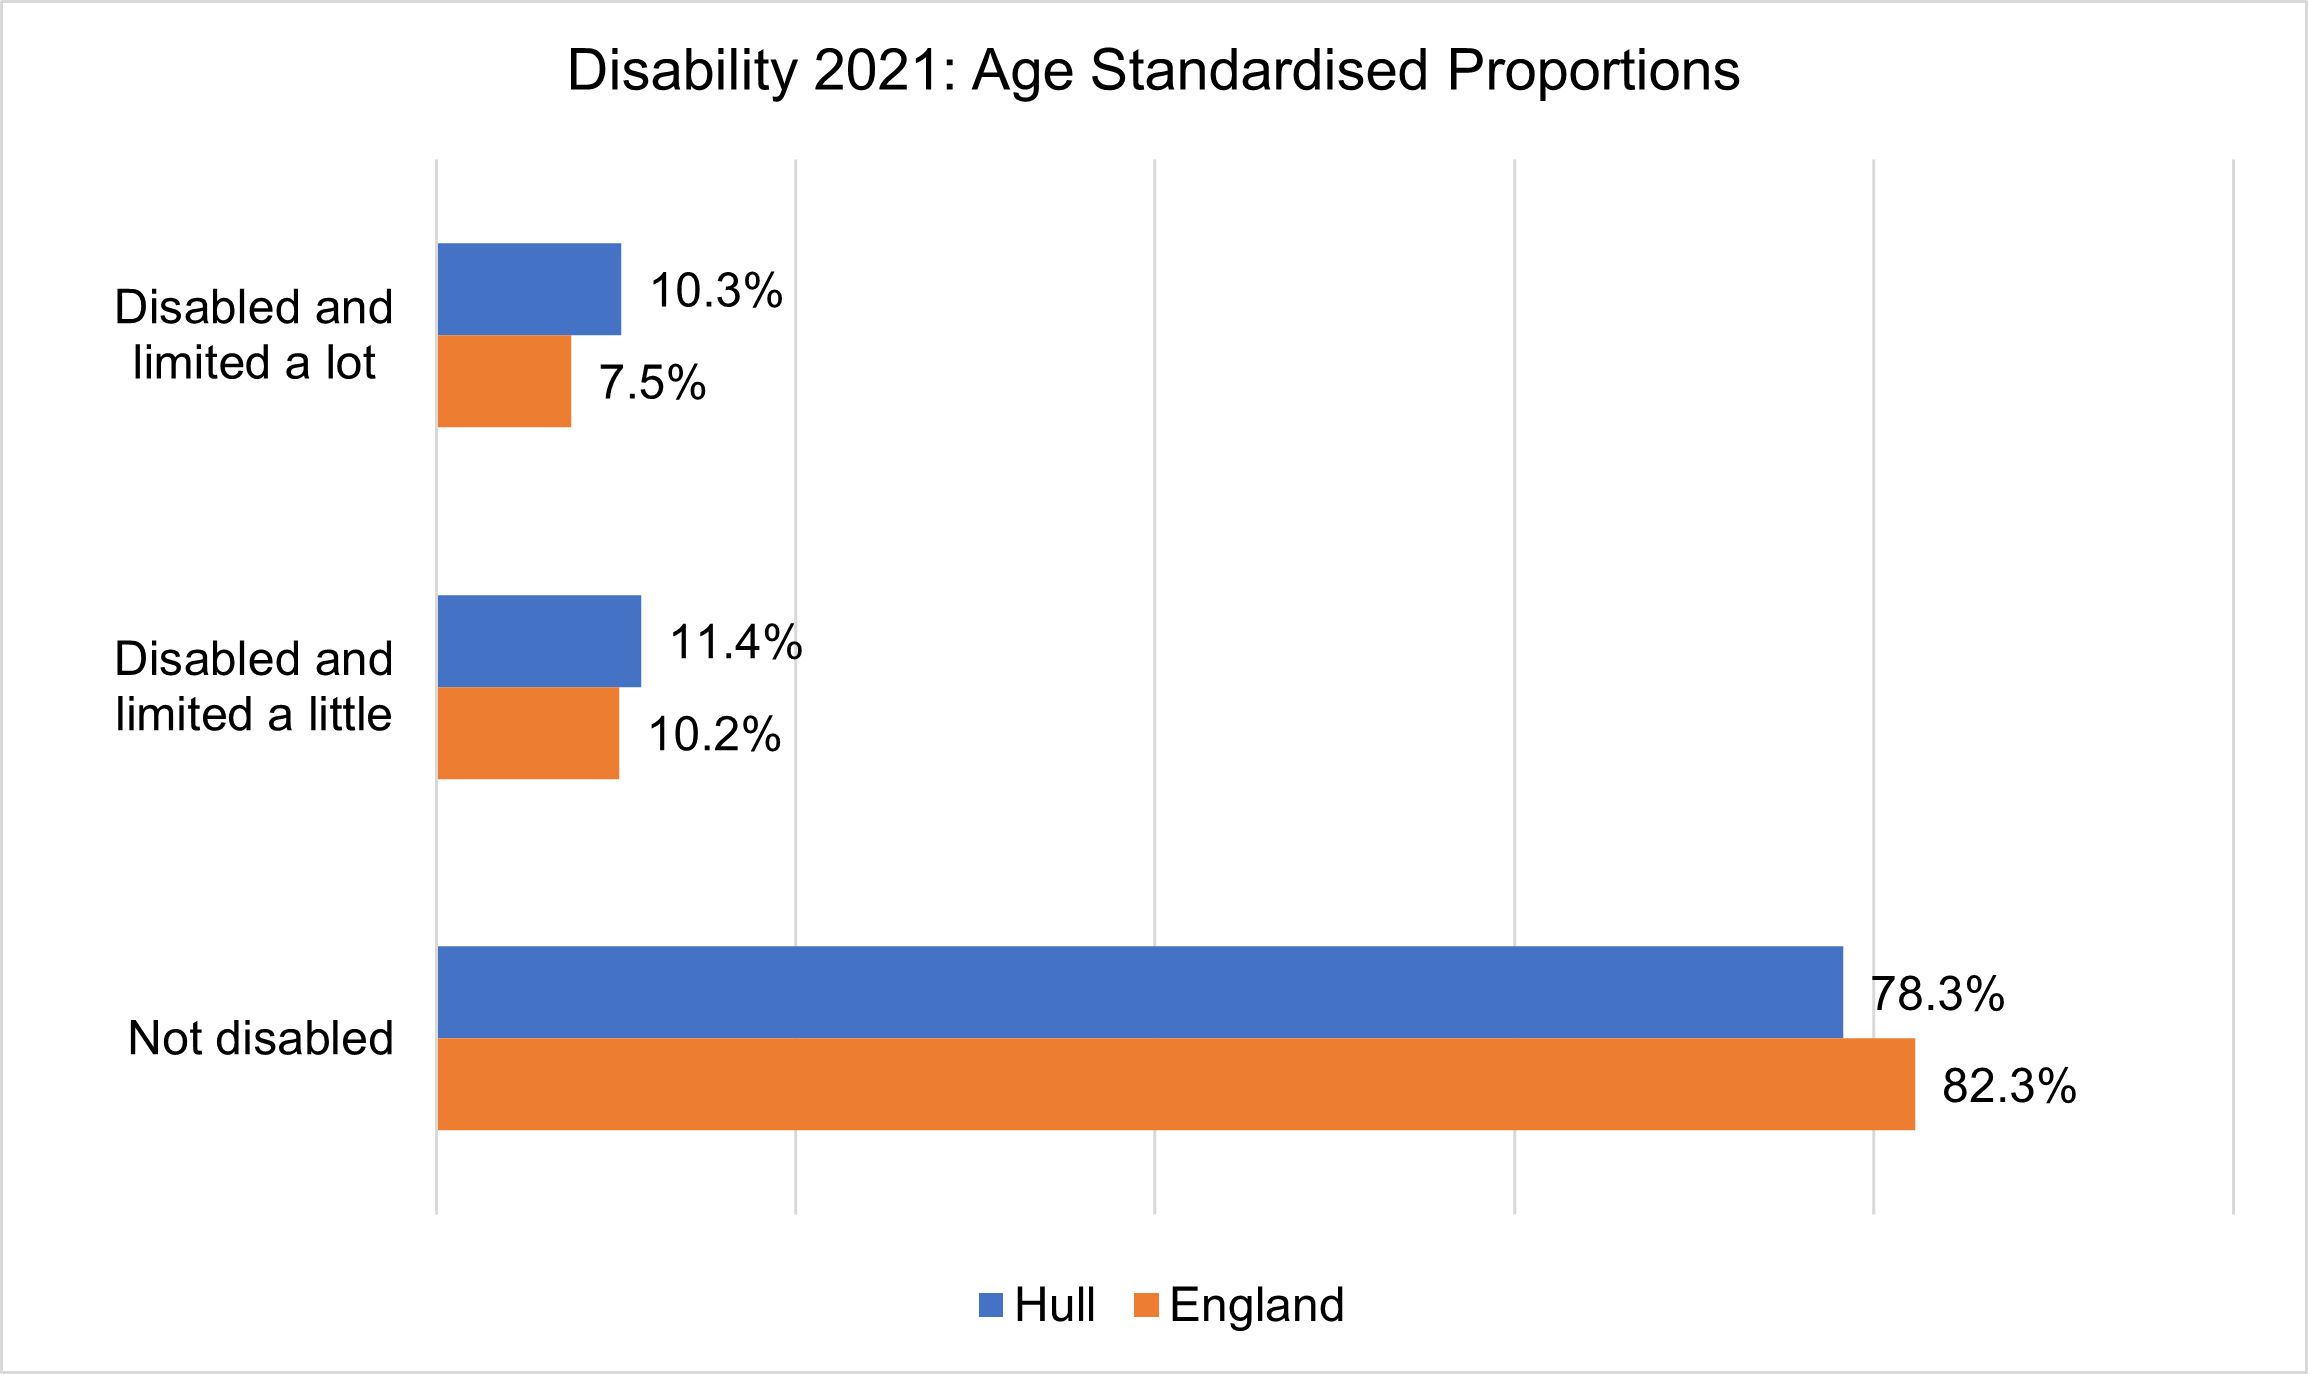
COMPARISON WITH ENGLAND (AGE-STANDARDISED PROPORTIONS)
In Hull, the data on disability shows that there is a larger proportion of people who are disabled, both limited a lot and a little, compared to England.
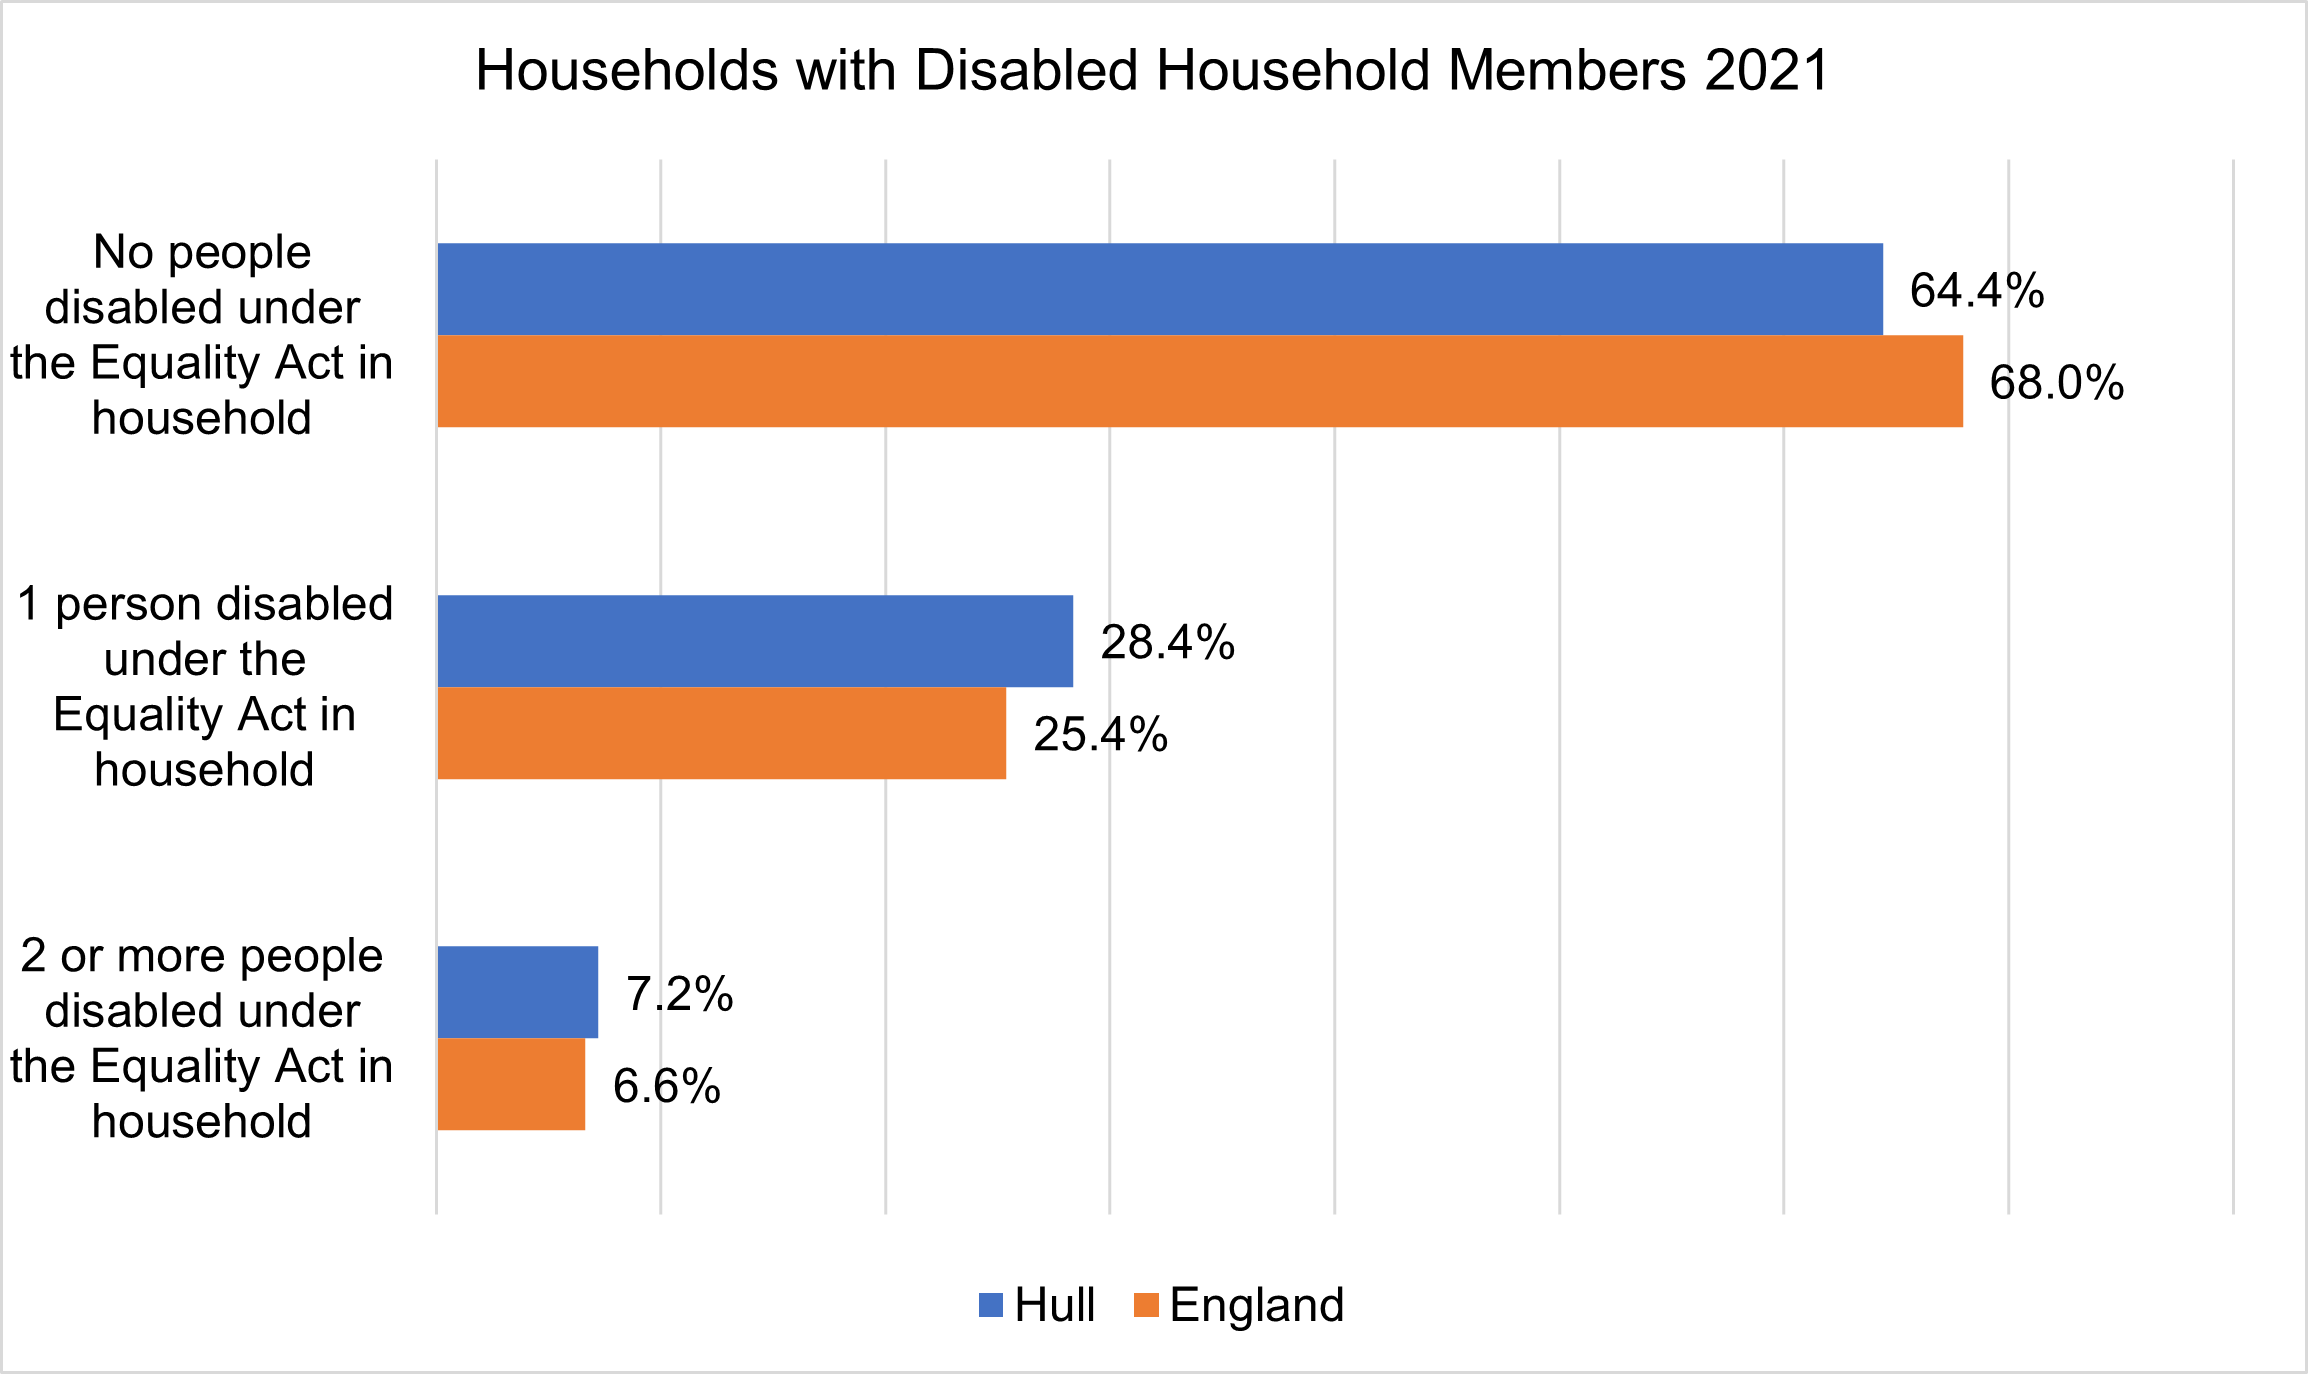
Cooared to England, there are also a greater proportion of households with a disabled household member.
NUMBERS AND MAPS (NON-AGE-STANDARDISED DATA)
- 53,395 residents of Hull are disabled under the Equalities act
- A further 15,133 residents of Hull are not disabled under the Equality Act but have long term physical or mental health condition that does not limit their day-to-day activities
| Hull (2021) | England (2021) | Hull (2011) | |
|---|---|---|---|
| Disabled and Limited a Lot | 24,662 (9.2%) | 7.3% | 25,672 (10.0%) |
| Disabled and Limited a Little | 28,733 (10.8%) | 10.0% | 24,719 (9.6%) |
| Not Disabled | 213,616 (80.0%) | 82.7% | 206,015 (80.2%) |
- 41,093 households in Hull contain at least one disabled household resident
| Hull (2021) | England (2021) | Hull (2011) | |
|---|---|---|---|
| 1 person disabled under the Equality Act in household | 32,763 (28.4%) | 25.4% | 30,984 (27.5%) |
| 2 or more people disabled under the Equality Act in household | 8,330 (7.2%) | 6.6% | 8,163 (7.2%) |
| No people disabled under the Equality Act in household | 74,379 (64.4%) | 68.0% | 73,449 (65.2%) |
2021 Census Map: Equalities Act Disabled (LSOA)
2021 Census Map: Households With At Least One Disabled Resident (LSOA)
PROVISION OF UNPAID CARE
Census 2021 asked “Do you look after, or give any help or support to, anyone because they have long-term physical or mental health conditions or illnesses, or problems related to old age?”. People were asked to exclude anything they did as part of their paid employment. The wording of the question differs from the 2011 Census question, which began “Do you look after, or give any help or support to family members, friends, neighbours or others”.
Census 2021 was undertaken during the coronavirus (COVID-19) pandemic, which may also have influenced how people perceived and undertook their provision of unpaid care and therefore may have affected how people chose to respond.
CHANGE 2011 – 2021 (AGE-STANDARDISED PROPORTIONS)
In Hull, the data on unpaid care shows that whilst there has been a decrease in the proportion of residents providing unpaid care; this reduction has largely occurred amongst those providing 19 or less hours unpaid care a week. In fact, there has been a small increase in the proportion providing 20 to 49 hours unpaid care a week, and no change in the proportion providing 50+ hours a week.
![]()
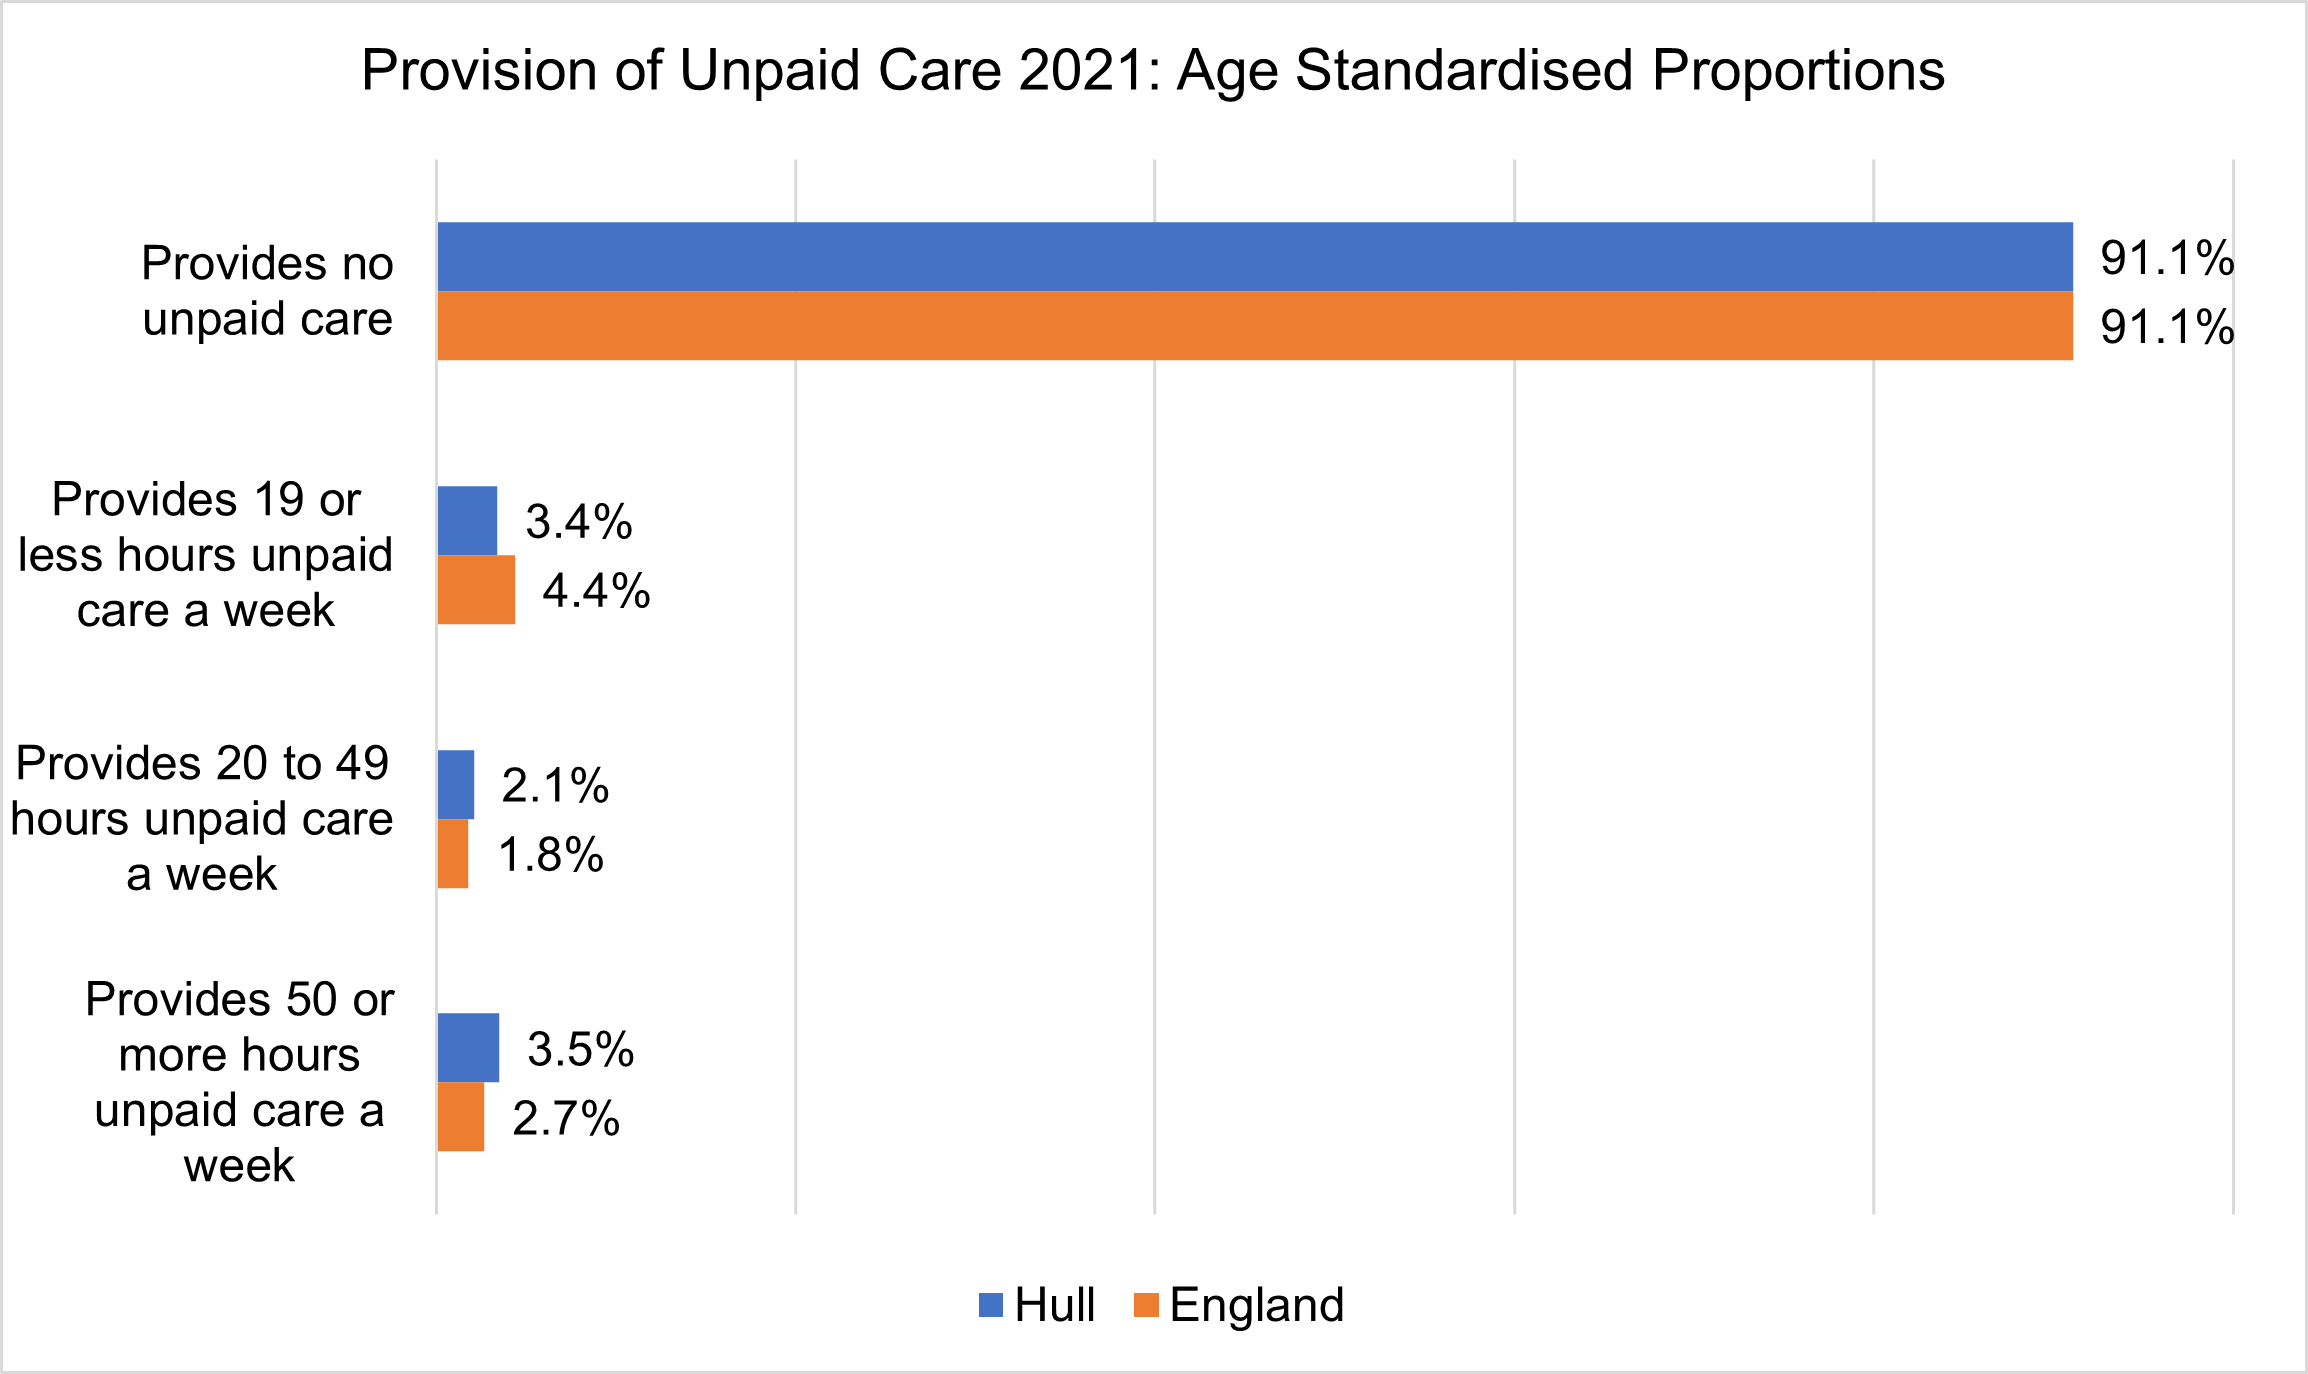
COMPARISON WITH ENGLAND (AGE-STANDARDISED PROPORTIONS)
In Hull, the data on unpaid care shows that whilst a similar total proportion of residents provide unpaid care as England, residents of Hull are more likely to to provide more hours of unpaid care than nationally.
NUMBERS AND MAPS (NON-AGE-STANDARDISED DATA)
- 21,241 residents in Hull provide some level of unpaid care
- 13,093 of these provide 20 or more hours of unpaid care
| Provides no unpaid care | 245,774 (92.0%) | 91.7% | 232,770 (90.8%) |
|---|---|---|---|
| Provides 1 to 19 hours unpaid care a week | 8,148 (3.1%) | 4.1% | 12,602 (4.9%) |
| Provides 20 to 49 hours unpaid care a week | 5,147 (1.9%) | 1.7% | 3,622 (1.4%) |
| Provides 50 or more hours unpaid care a week | 7,946 (3.0%) | 2.5% | 7,412 (2.9%) |
2021 Census Map: Provides Unpaid Care (LSOA)
2021 Census Map: Provides 20+ Hours a Week Unpaid Care (LSOA)