Since January 2020, the People’s Panel has been consistently measuring resident health and wellbeing against seven key indicators:
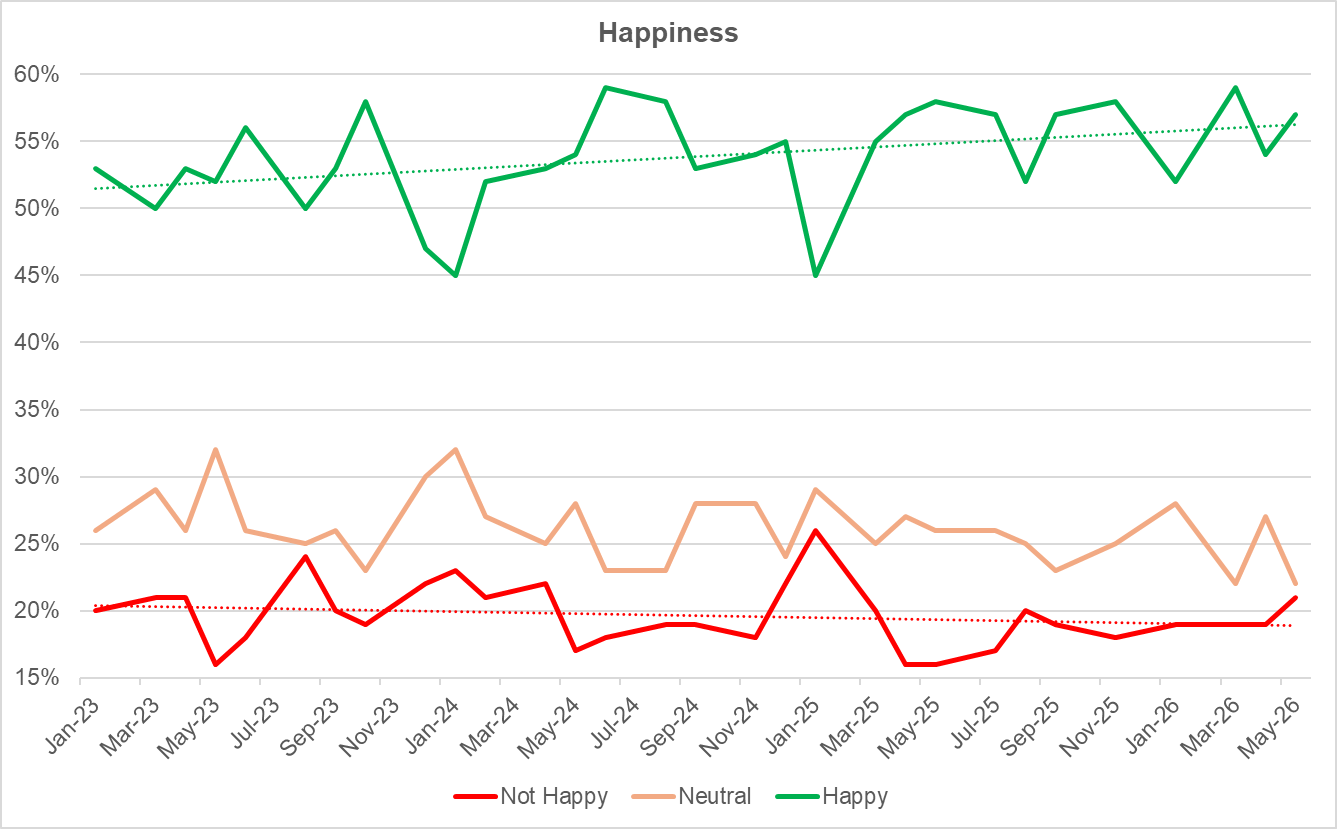
- Happiness
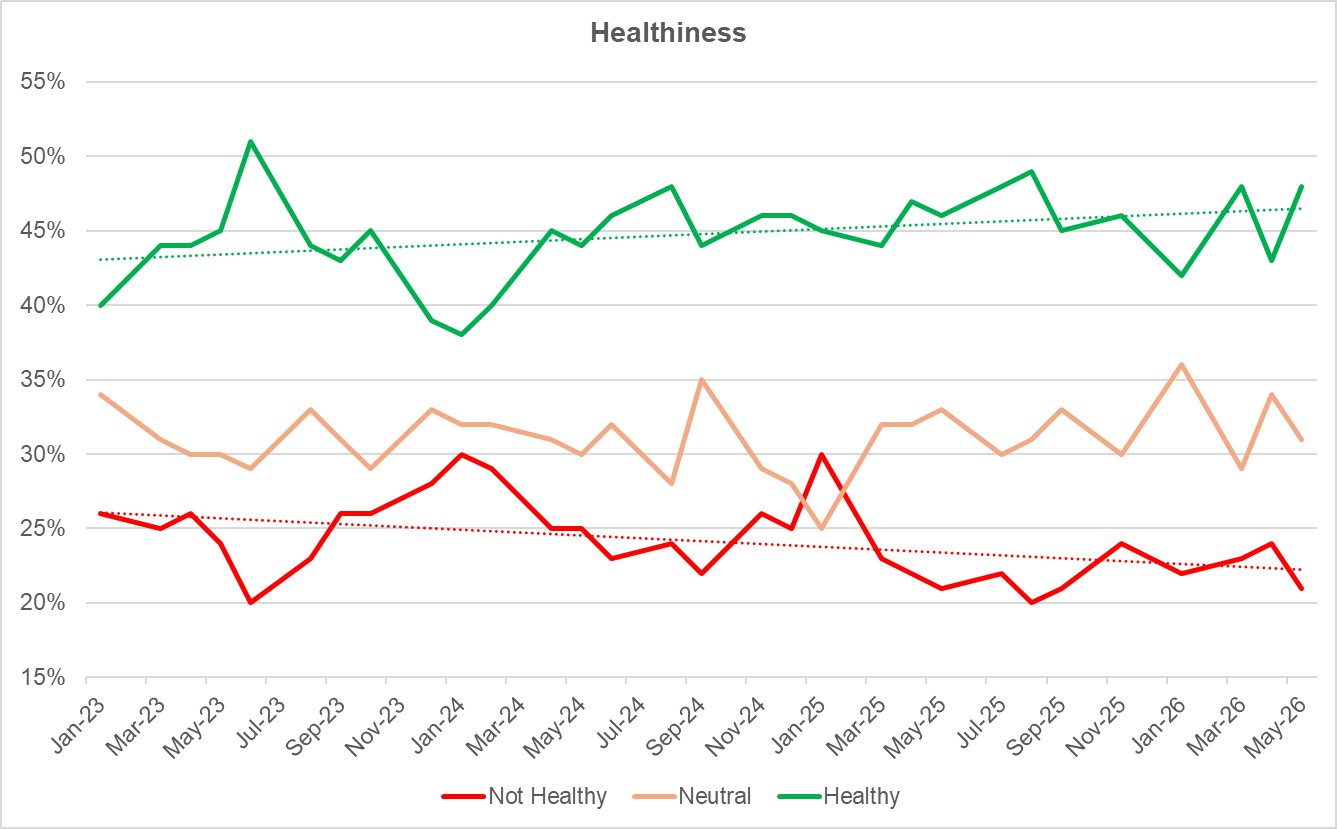
- Healthiness
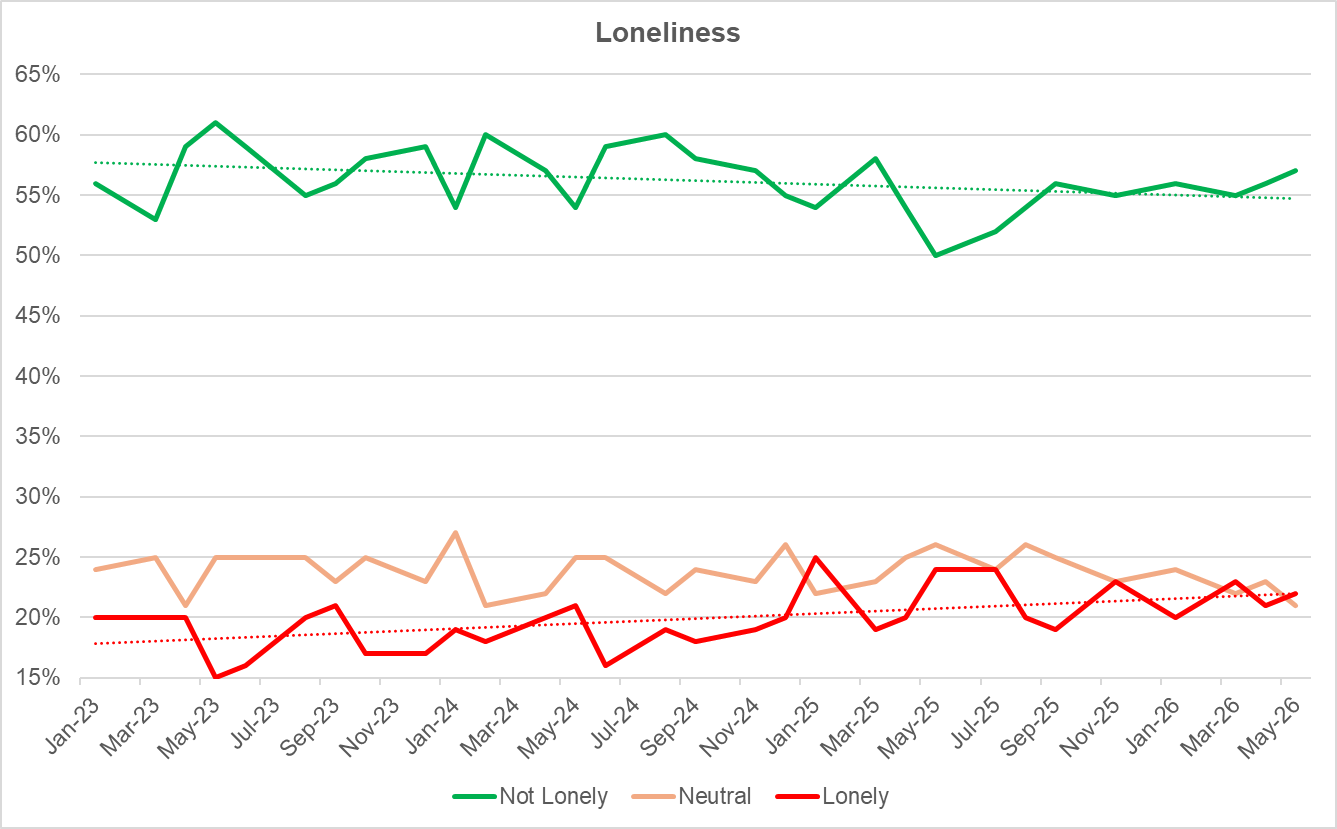
- Loneliness
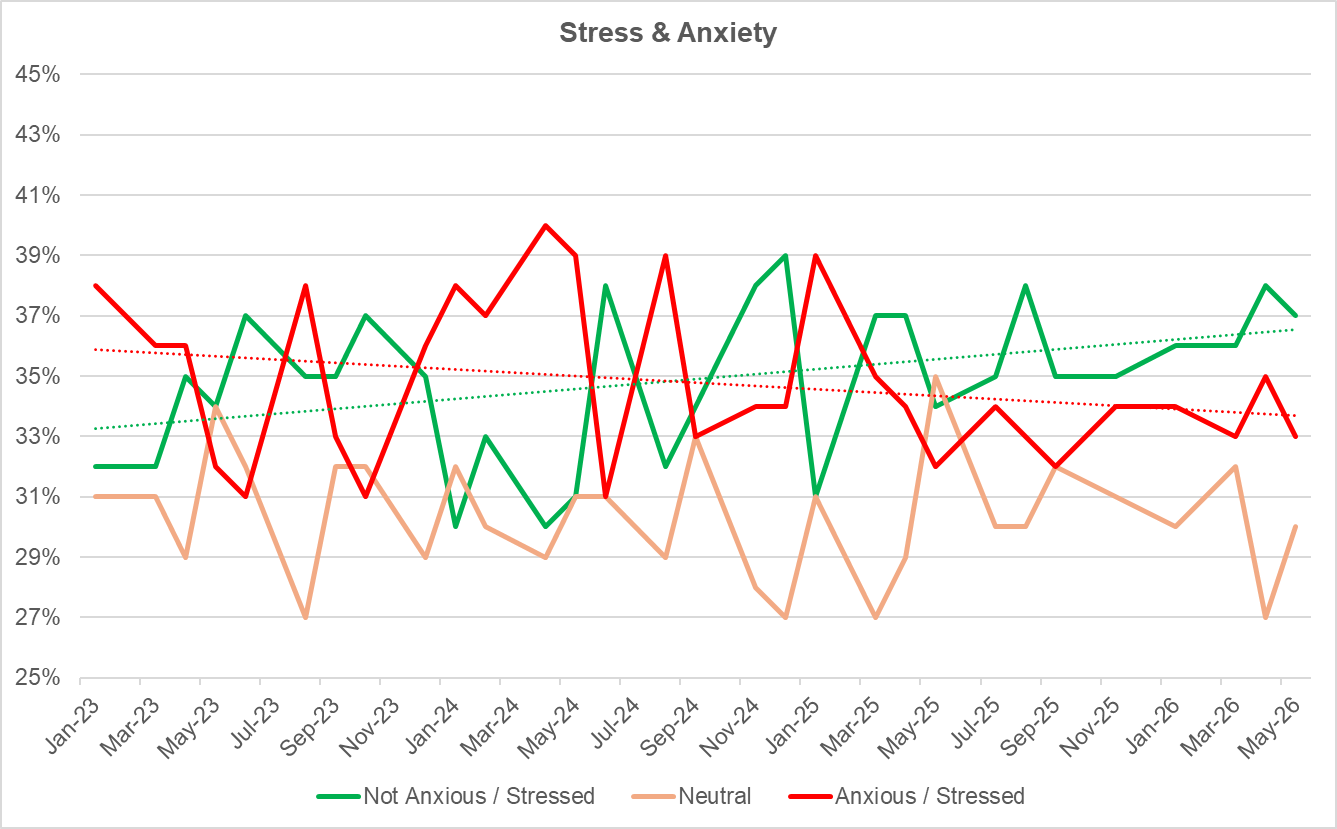
- Feelings of stress / anxiety
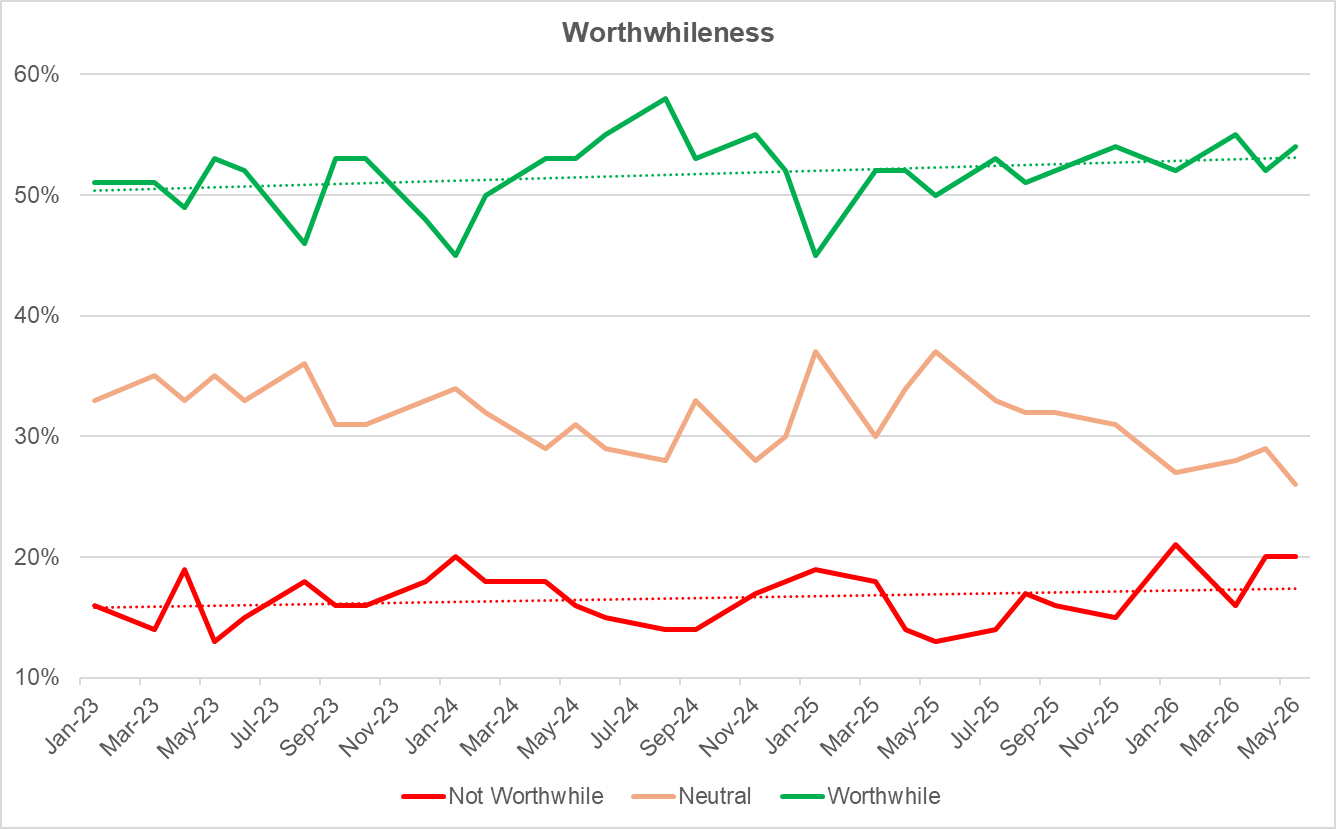
- Worthwhileness
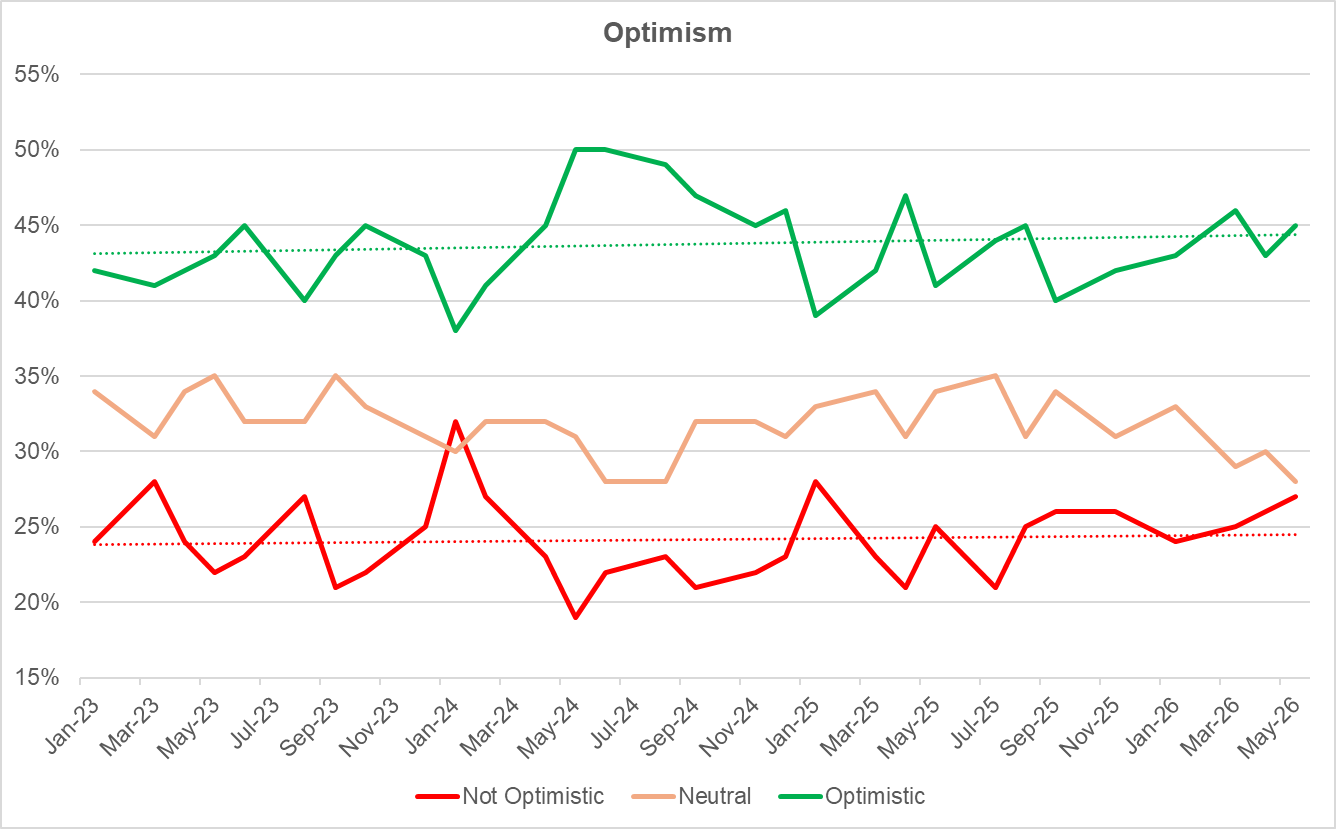
- Optimism
- Hopefulness
For each indicator residents are asked to rate how they currently feel from 1 (Not at all) to 5 (Very) e.g. from not at all happy to very happy.
The charts below show the time series data for each of these seven indicators.
In each case, responses have been grouped to form 3 key measures for each indicator:
- A positive measure – shown in green
-
- Happy (Rating of 4 or 5)
- Healthy (Rating of 4 or 5)
- Not lonely (Rating of 1 or 2)
- Not anxious or stressed (Rating of 1 or 2)
- Worthwhile (Rating of 4 or 5)
- Optimistic (Rating of 4 or 5)
- Hopeful (Rating of 4 or 5)
-
- A neutral measure – shown in orange (Rating of 3 for all indicators)
- A negative measure – shown in red
-
- Not happy (Rating of 1 or 2)
- Not healthy (Rating of 1 or 2)
- Lonely (Rating of 4 or 5)
- Anxious or stressed (Rating of 4 or 5)
- Not worthwhile (Rating of 1 or 2)
- Not optimistic (Rating of 1 or 2)
- Not hopeful (Rating of 1 or 2)
-
Each chart also shows (as a dotted line) the trend line for the positive and negative measures over the reporting period – to give an indication of direction of travel.
Download the data for these charts here
These questions are asked in every People’s Panel survey, and the data and charts will be updated after the results of each Panel survey have been analysed.