The Data
Hull Training and Adult Education provided us with anonymised details of all enrolments to the service during the 2021/22 academic year.
This data included, for every enrolment,:
Applying The Segmentation
Using the learner’s postcode, the Insight Team were able to assign each Hull learner to one of their 13 bespoke customer segments.
You can find out more about the segmentation model here: Hull Data Observatory – Customer Insight
Overall Segment Engagement Rates
The first step was to calculate how many learners / service users came from each segment.
Since some of the customer segments are naturally much larger than others, then we would naturally expect more learners to come from specific segments.
Therefore, we standardise the data by calculating the rate of engagement based on the relative size of the 16+ population within each segment.
This allows us to directly compare the rate of engagement between segments.
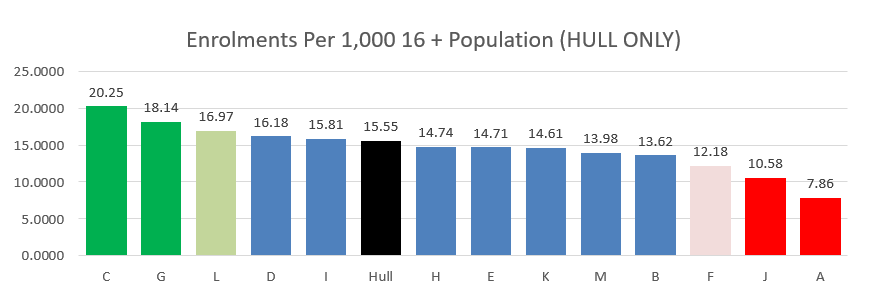
This clearly shows that the most engaged segments are:
This allows the Hull Training and Adult Education Service to ask questions like:
Engagement With Specific Areas of Learning
The next step was to look in more detail at:
Whilst these two things sound similar – they show two fundamentally different things.
Lets take Group C, as the most engaged customer segment, as an example.
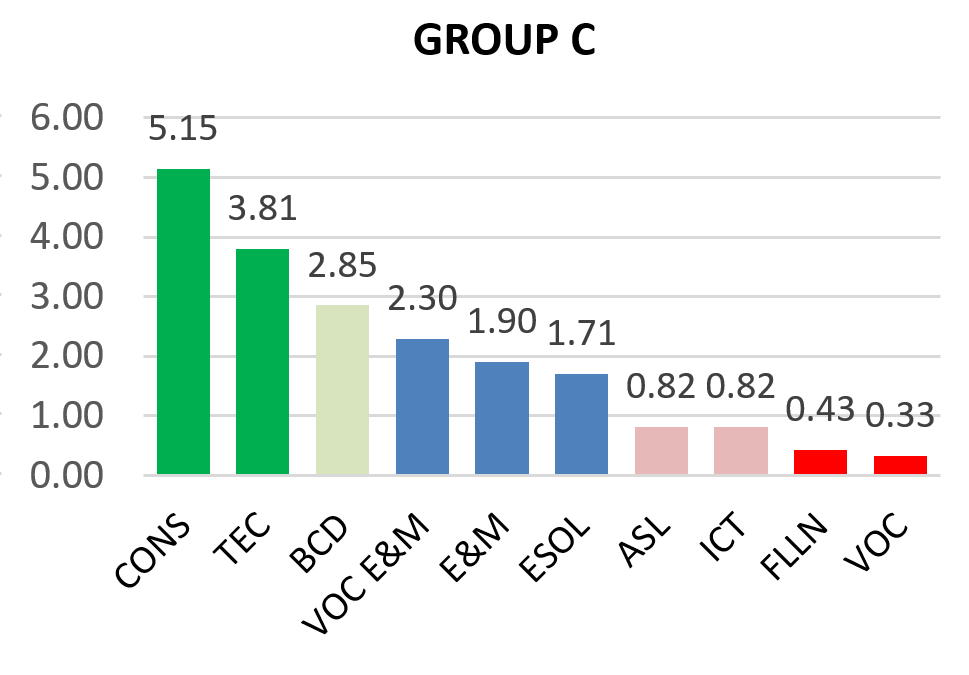
Across all courses, Group C are more likely than average to enrol in the following areas of learning:
and less likely than average to enrol in the following areas of learning:
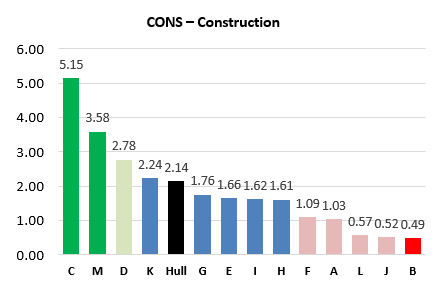
When we look at the breakdown of learners in Construction courses, Group C are the most engaged segment.
So since Group C is high in both this chart and the first chart then this means that Construction courses are an “easy sell” for this segment.
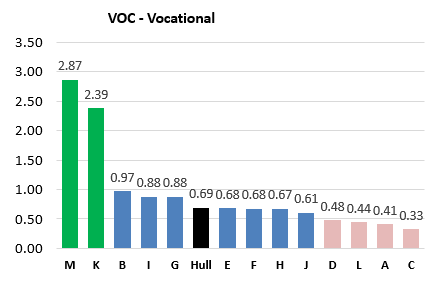
When we look at the breakdown of learners in Vocational courses, Group C are the least engaged segment.
So since Group C is low in both this chart and the first chart then this means that Vocational courses are a “hard sell” for this segment.
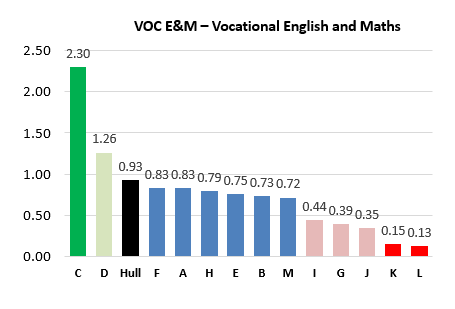
Finally, when we look at the breakdown of learners in Vocational English and Maths courses, Group C are the most engaged segment.
However, they were not significantly high for this area of learning in the first chart.
This means that Vocational English and Maths courses have “room for growth” for this segment.
Segmenting Additional Information
The next step was to segment the other indicators to enrich our understanding of learners in each segment.
Continuing to use Group C as an example:
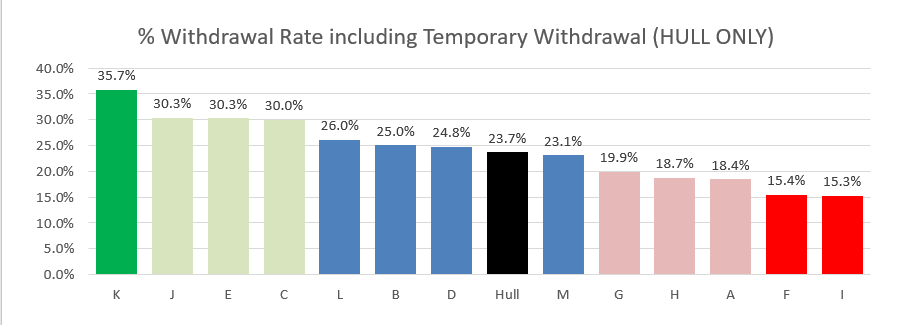
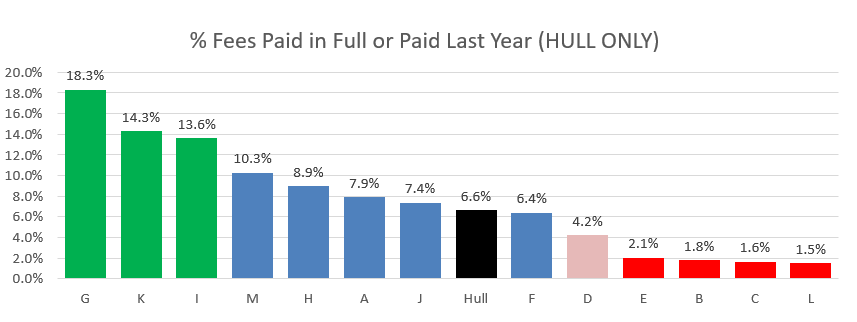
For example, now we know that Group C are also:
Combining with Existing Segment information
The final step was to combine the above learning, with our existing knowledge of the segments to inform marketing and service provision.
Still using Group C as an example we know the following from previous research:
Their key barriers include:
They are experiential decision makers: Open to new ideas, concepts and offers if they are presented in an original and entertaining way.
Their key influences are: